

We are just amazed how quickly 2016 has flown by!
This year has brought change and innovation for our team, and we're eager to continue that trend. As they year comes to a close, we wanted share a compilation of our 10 most read blog posts from these past 12 months so that you can have valuable information at your fingertips as you look ahead.
1. 3 Tips to Get Leadership to Value UX Using Business Outcomes
A few years ago, we were working with a Fortune 500 company who staffed a few designers who thought they were Apple designers (they weren’t). The lead designer of the team designed a UI that had serious usability issues when we tested it. Unfortunately, we’ve recognized that some UX designers resist learning from even the most constructive criticism bolstered by actual user research. We were not surprised when the first release of their mobile app received a 2 star rating. Read more...
2. Outstanding UX Research Naturally Leads Us to UX Design

When you look to your left and you’re seated beside a driven tech visionary and to your right sits a graceful, yet glaringly classic overachiever, it’s safe to say that you have to get used to rule bending and change. Read more...
3. INFOGRAPHIC: Best Mobile UX Experiences in Auto Insurance

In September 2015, Key Lime Interactive concluded a biannual competitive review of the competitive landscape in the auto insurance industry while highlighting the importance of how the specific companies are meeting the needs and expectations of their target users. Read more...
4. IoT User Experience Strategies That Work

Internet of Things (IoT) is the new frontier in tech. Chief Experience Officers have the tremendous opportunity to seize large market shares by prioritizing IoT experience design, and IoT’s rapid deployment will only accelerate as more devices become Wi-Fi enabled. Read more...
5. 11 Tips to Develop Your User Empathy Journey Map

“There are two ways to share knowledge: You can PUSH information out or you can PULL them in with a STORY.” While most of us are regularly faced with reading PowerPoint presentations to understand research results, we rarely get the pleasure of hearing a great story that rings our empathy bell. That’s usually what I yearn for when I go to conferences. The food and networking is great, but what I always remember and share with others are the presentations that told me a great story. Read more...
6. Choosing the Right Survey Tool for Quantitative UX Research

Choosing the proper tool for the task is important in any profession, whether you’re a carpenter, a surgeon, or a UX Researcher. But on a tight budget or a tight schedule, it can be difficult to put aside time to research different offerings, compare pricing and capabilities, and select the right online survey tool. Luckily, at Key Lime Interactive, we’ve spent years working with some of the most popular survey tools on the market, and can help point you in the right direction. To help with this, we’ve created a flow chart that helps point businesses of all sizes in choosing the right survey tool for quantitative ux research. Before we get to the chart itself, let’s talk about a few major considerations to make prior to selecting the right tool. Read more...
7. Eye Tracking: Why Are We Trained to Recognize Other Human Faces?

Our brains are hardwired to detect and identify faces. The brain has a specific region for recognizing faces called the fusiform gyrus, or the fusiform face area. This specialized part of our brain helps us to identify faces within less than a second and to quickly distinguish one face from another. Our eyes tend to quickly locate and lock onto images of people and their faces. Read more...
8. How to Plan for a Quantitative UX Competitive Benchmark Study

It’s important to start by building a strong foundation for your benchmarking study. This is not a one-off project. You’re designing it once, to run multiple times. So, before you jump in, first make sure you take the time for proper planning by asking and answering some essential questions, like how to plan for a quantitative UX competitive benchmark study. Read more...
9. INFOGRAPHIC: 7 Universal Expressions of Emotion
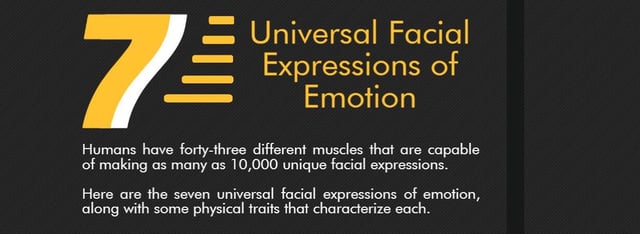
Humans have forty-three different muscles that are capable of making as many as 10,000 unique facial expressions. Here are the 7 universal expressions of emotion, along with some physical traits that characterize each. Read more...
10. INFOGRAPHIC: The Role of Body Language in User Research
In February 2016, Key Lime Interactive wrote an article on The Role of Body Language in User Research. These are the highlights of our findings. Read more...
CONCLUSION
We've noted that three of our top ten posts in 2016 were infographics. That tells us that you enjoy information presented to you this way! We're paying attention and look foward to sharing the latest trends, our thoughts and words of wisdom, as well as new techniques with you in 2017. Together we can ensure that your UI & UX strategies succeed in any industry.


Comments
Add Comment